System Status
The System Status page gives you a live, at-a-glance view of whether the services behind your account are running normally. If a message ever seems slow to send or a page won’t load, this is the first place to check whether it’s something on our side.
The Status Card
At the bottom of the left sidebar, under Credits, you’ll see a Status row with a colored dot, always visible so you get an early heads-up without going looking for it.
| Dot | Meaning |
|---|---|
| Green — Online | Everything is running normally. |
| Amber — Degraded | One or more services are slower than usual, but still working. |
| Red — Issues | We’re having a service disruption on our side. |
Click the card to open the full System Status page.
The Status Page
The page lists each part of the platform and how it’s doing right now, each shown as Operational, Degraded, or Down. These aren’t simple on/off checks — a component turns Degraded when it’s running slowly (for example, messages taking longer than usual to go out), not only when something is fully down, so you get an early heads-up.
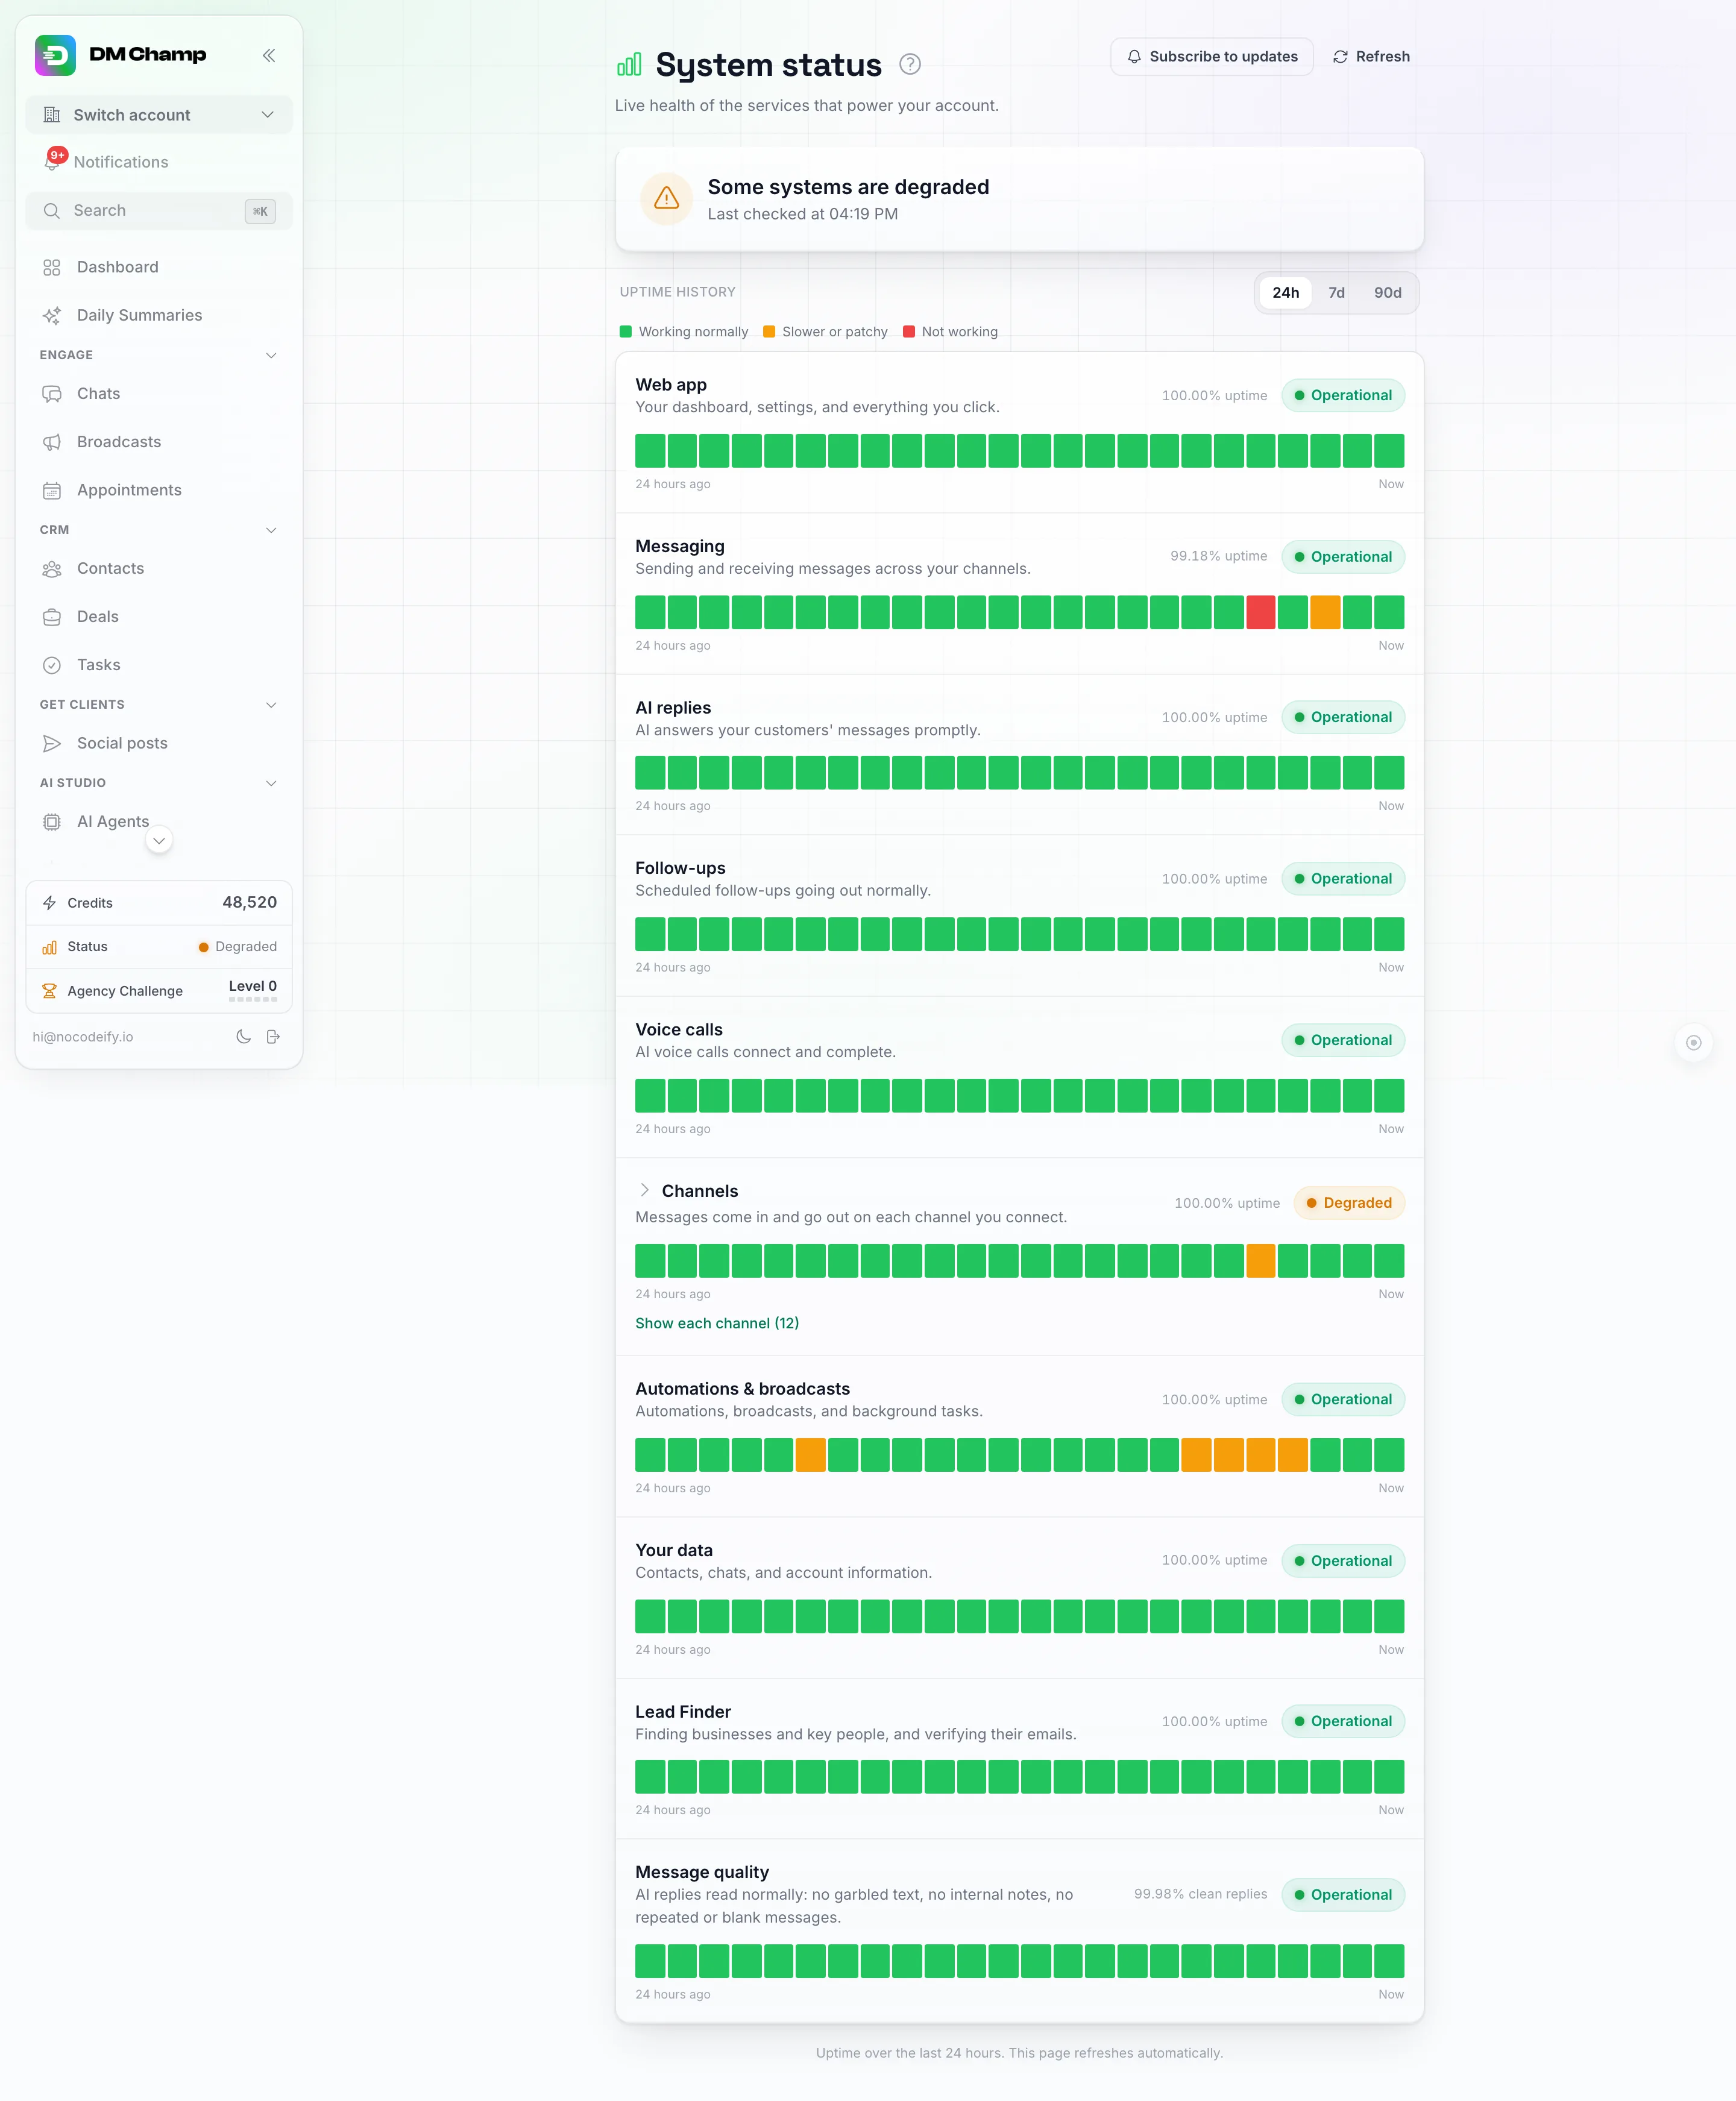
The full status page: the overall banner up top, Subscribe to updates next to Refresh, then one row per component with its own uptime history strip, including AI replies, Follow-ups, Voice calls and Channels.
The page refreshes on its own; press Refresh to check again straight away.
Get an Email When Something Goes Down
You don’t have to keep the page open to find out about an outage. Press Subscribe to updates at the top of the System Status page, check the email address (it’s filled in for you) and press Subscribe.
- Check your inbox for the confirmation email and press Confirm on the page it opens. Nothing is sent until you confirm.
- From then on, you get one email when a part of the platform goes down, and one when it’s back, including how long it lasted.
- Short blips of a minute or two and slow patches (Degraded) don’t send an email, so you only hear about real outages.
Every email has an Unsubscribe link. It stops the emails straight away, and you can subscribe again at any time.
The confirmation email, the page it opens and the outage emails arrive in the language the app is set to when you subscribe (Settings → Profile → Language, or the default language of the domain you sign in on). Subscribe again from the app in another language to switch, and the names of the parts of the platform on this page follow your app language too.
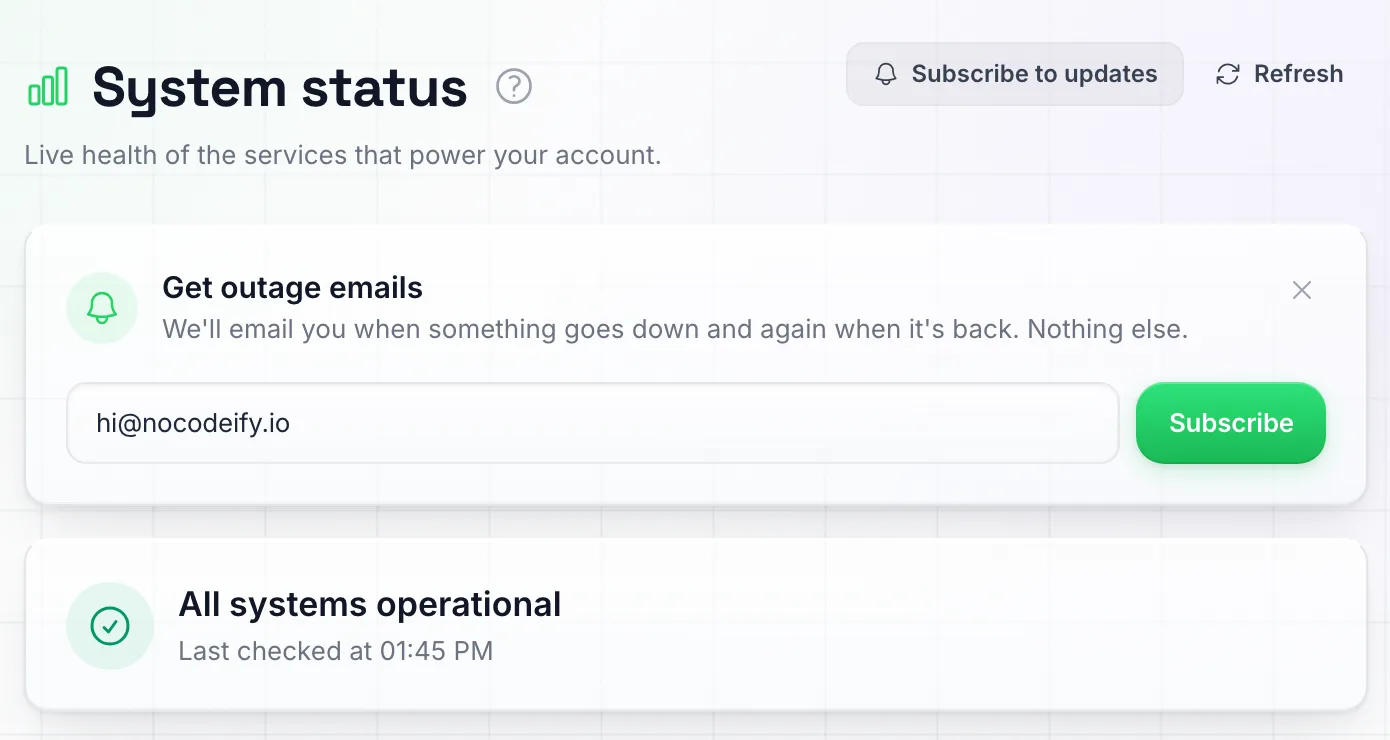
Press Subscribe to updates to open the panel, check the email address and press Subscribe.
Uptime History
Under each component, a strip of small bars shows its history — green for healthy, amber for a slow patch and red for an outage. A stretch with nothing to measure counts as working and shows green. Hover any bar to see the exact time window and uptime percentage for that slice.
A range switcher above the strip lets you choose the window:
| Range | Bar granularity |
|---|---|
| 24h | One bar per hour |
| 7d | One bar per two hours |
| 90d | One bar per day |
An uptime percentage for the selected range is shown alongside each component. Only outage time counts against it: a slow patch still counts as up.
The Message quality, Channels, AI replies, Follow-ups and Voice calls rows use the same 24h, 7d and 90d switch.
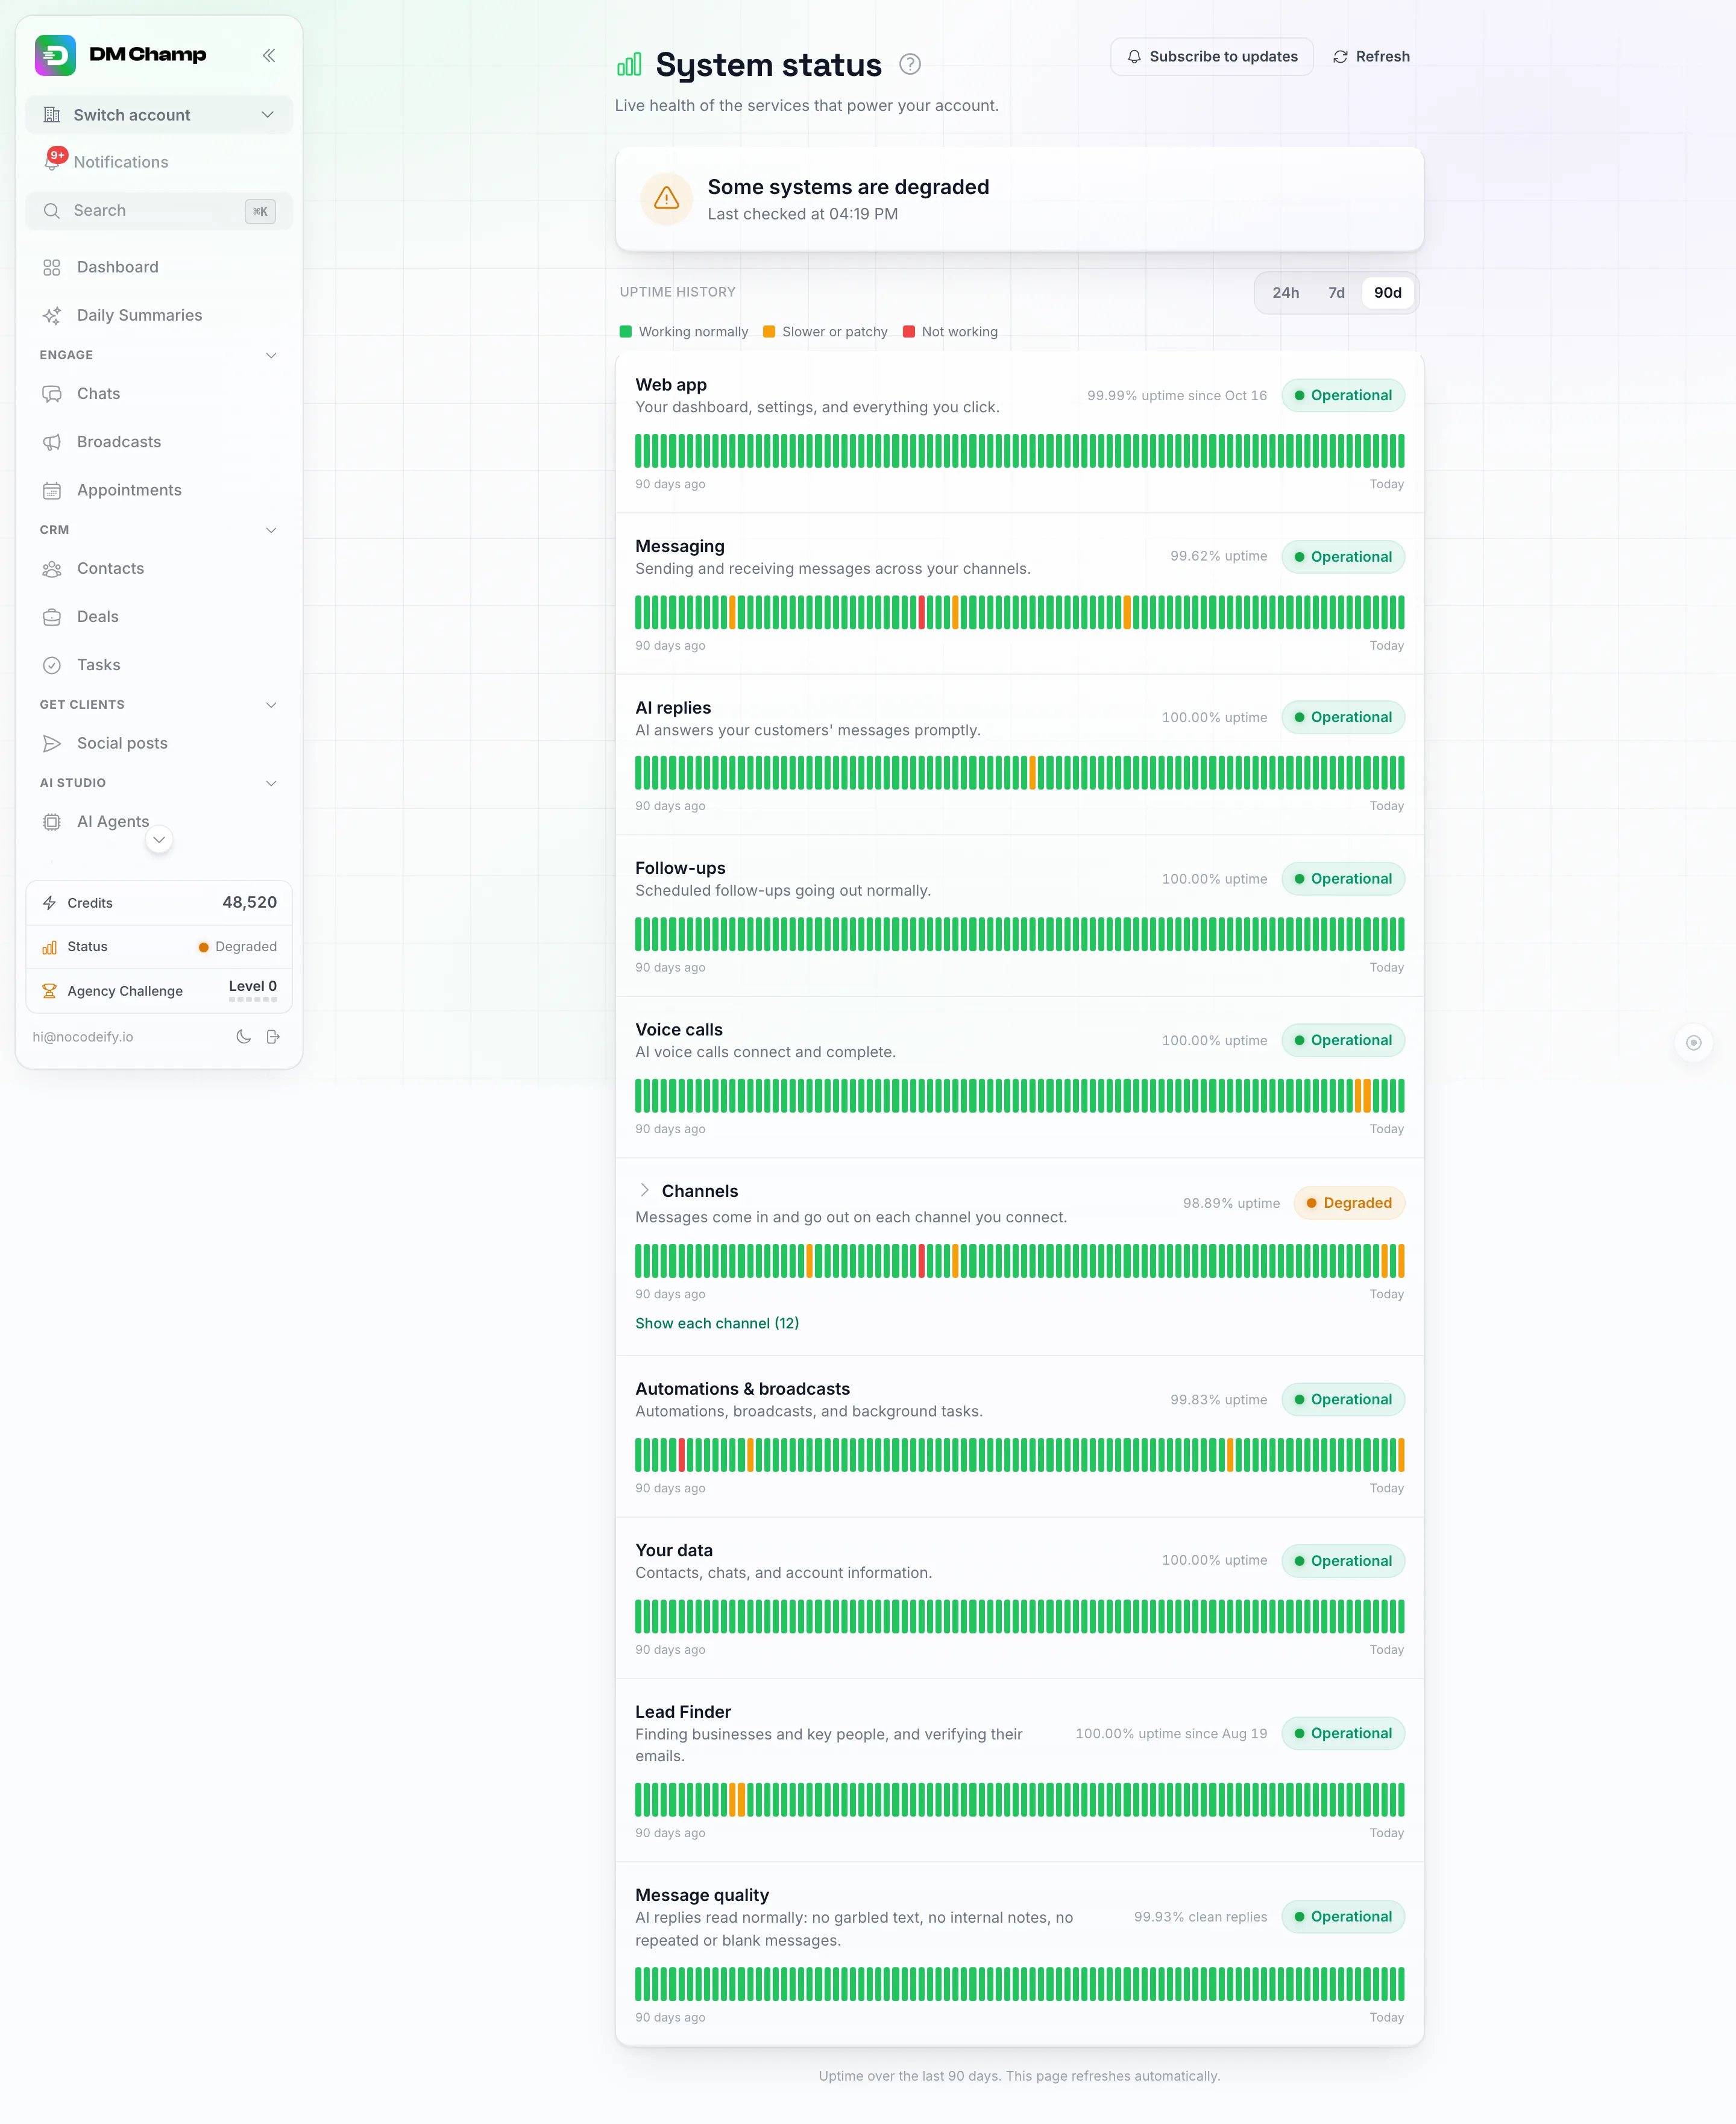
Switching to 90d: the range switcher (top right of the Uptime History section) shows one bar per day.
Message Quality
The Message quality row sits with the other components and tracks whether AI replies read normally: no garbled text, no internal notes, no repeated or blank messages.
Each bar is one day in UTC on the 90d range, one hour on 24h and two hours on 7d, just like the other bars. The colours mean:
| Colour | Meaning |
|---|---|
| Green | No problems worth noting |
| Amber | More than 1 in 100 replies came out wrong (below 99% clean) |
| Red | More than 1 in 20 replies came out wrong (below 95% clean) |
Hover a bar to see how many replies were checked and how many had a problem, for example “1,240 replies checked, 3 with a problem”, plus the share that came out clean.
Next to the row name you see X% clean replies instead of an uptime figure: the share of AI replies in the selected range that came out right.
A reply counts as having a problem when it had garbled text, contained an internal note that should not have been sent, was blank, was the same message sent twice in a row, or was cut off or never arrived. A bar needs at least 3 problem replies before it turns amber or red, so one or two incidents never colour it.
The row’s status pill shows Operational, or Degraded when fewer than 99% of the AI replies in the last 24 hours came out clean. It never shows Down, and it does not send outage emails to subscribers. If the quality data cannot be loaded, the row shows as working.
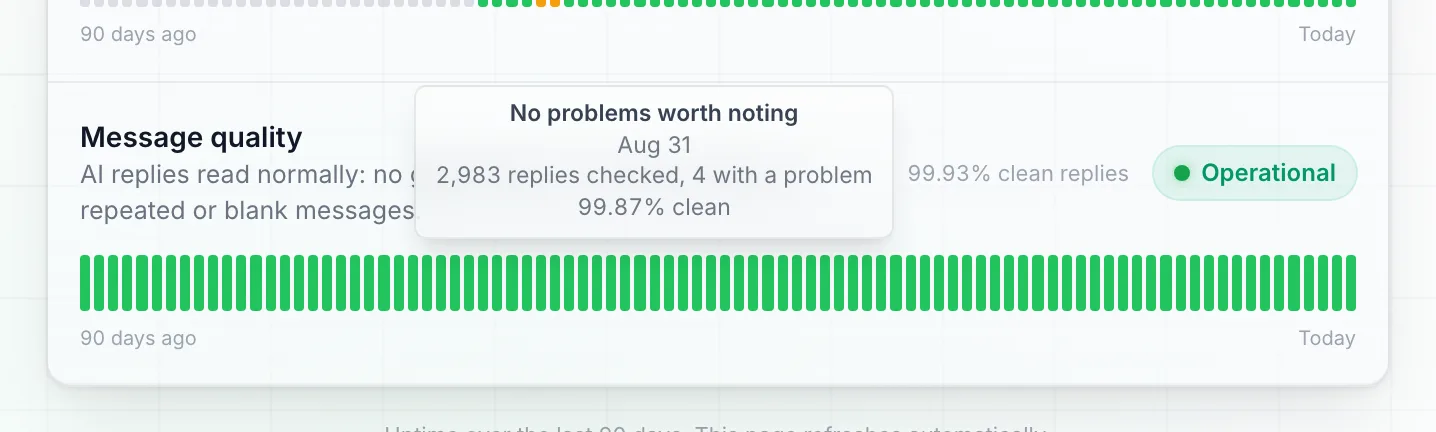
The Message quality row shows % clean replies instead of an uptime figure. Hover a bar to see how many replies were checked that day and how many had a problem.
Channels, AI Replies, Follow-ups and Voice Calls
These rows follow what actually happens with real messages across the platform, so they catch a problem that only touches one part of it, like one channel, even when everything else looks fine.
| Row | What it tracks |
|---|---|
| Channels | One row for each messaging channel (WhatsApp, Instagram, Messenger, Telegram, LinkedIn, Email, Website chat and more): messages coming in and going out normally, and for WhatsApp Web and Telegram, numbers staying connected. |
| AI replies | Your AI agents answering your customers’ messages promptly. |
| Follow-ups | Scheduled follow-ups going out normally. |
| Voice calls | AI voice calls connecting and completing normally. |
Channels is one row that opens up: click it, or Show each channel, to see a row per channel with its own bars and status. The row shows the worst status of its channels, and it opens by itself when one of them is not working. Every channel has its own row; a quiet channel shows green.
The status next to each of these rows is how it is doing right now. A slow patch earlier in the day stays visible as an amber bar, but once things are back to normal the row shows Operational again.
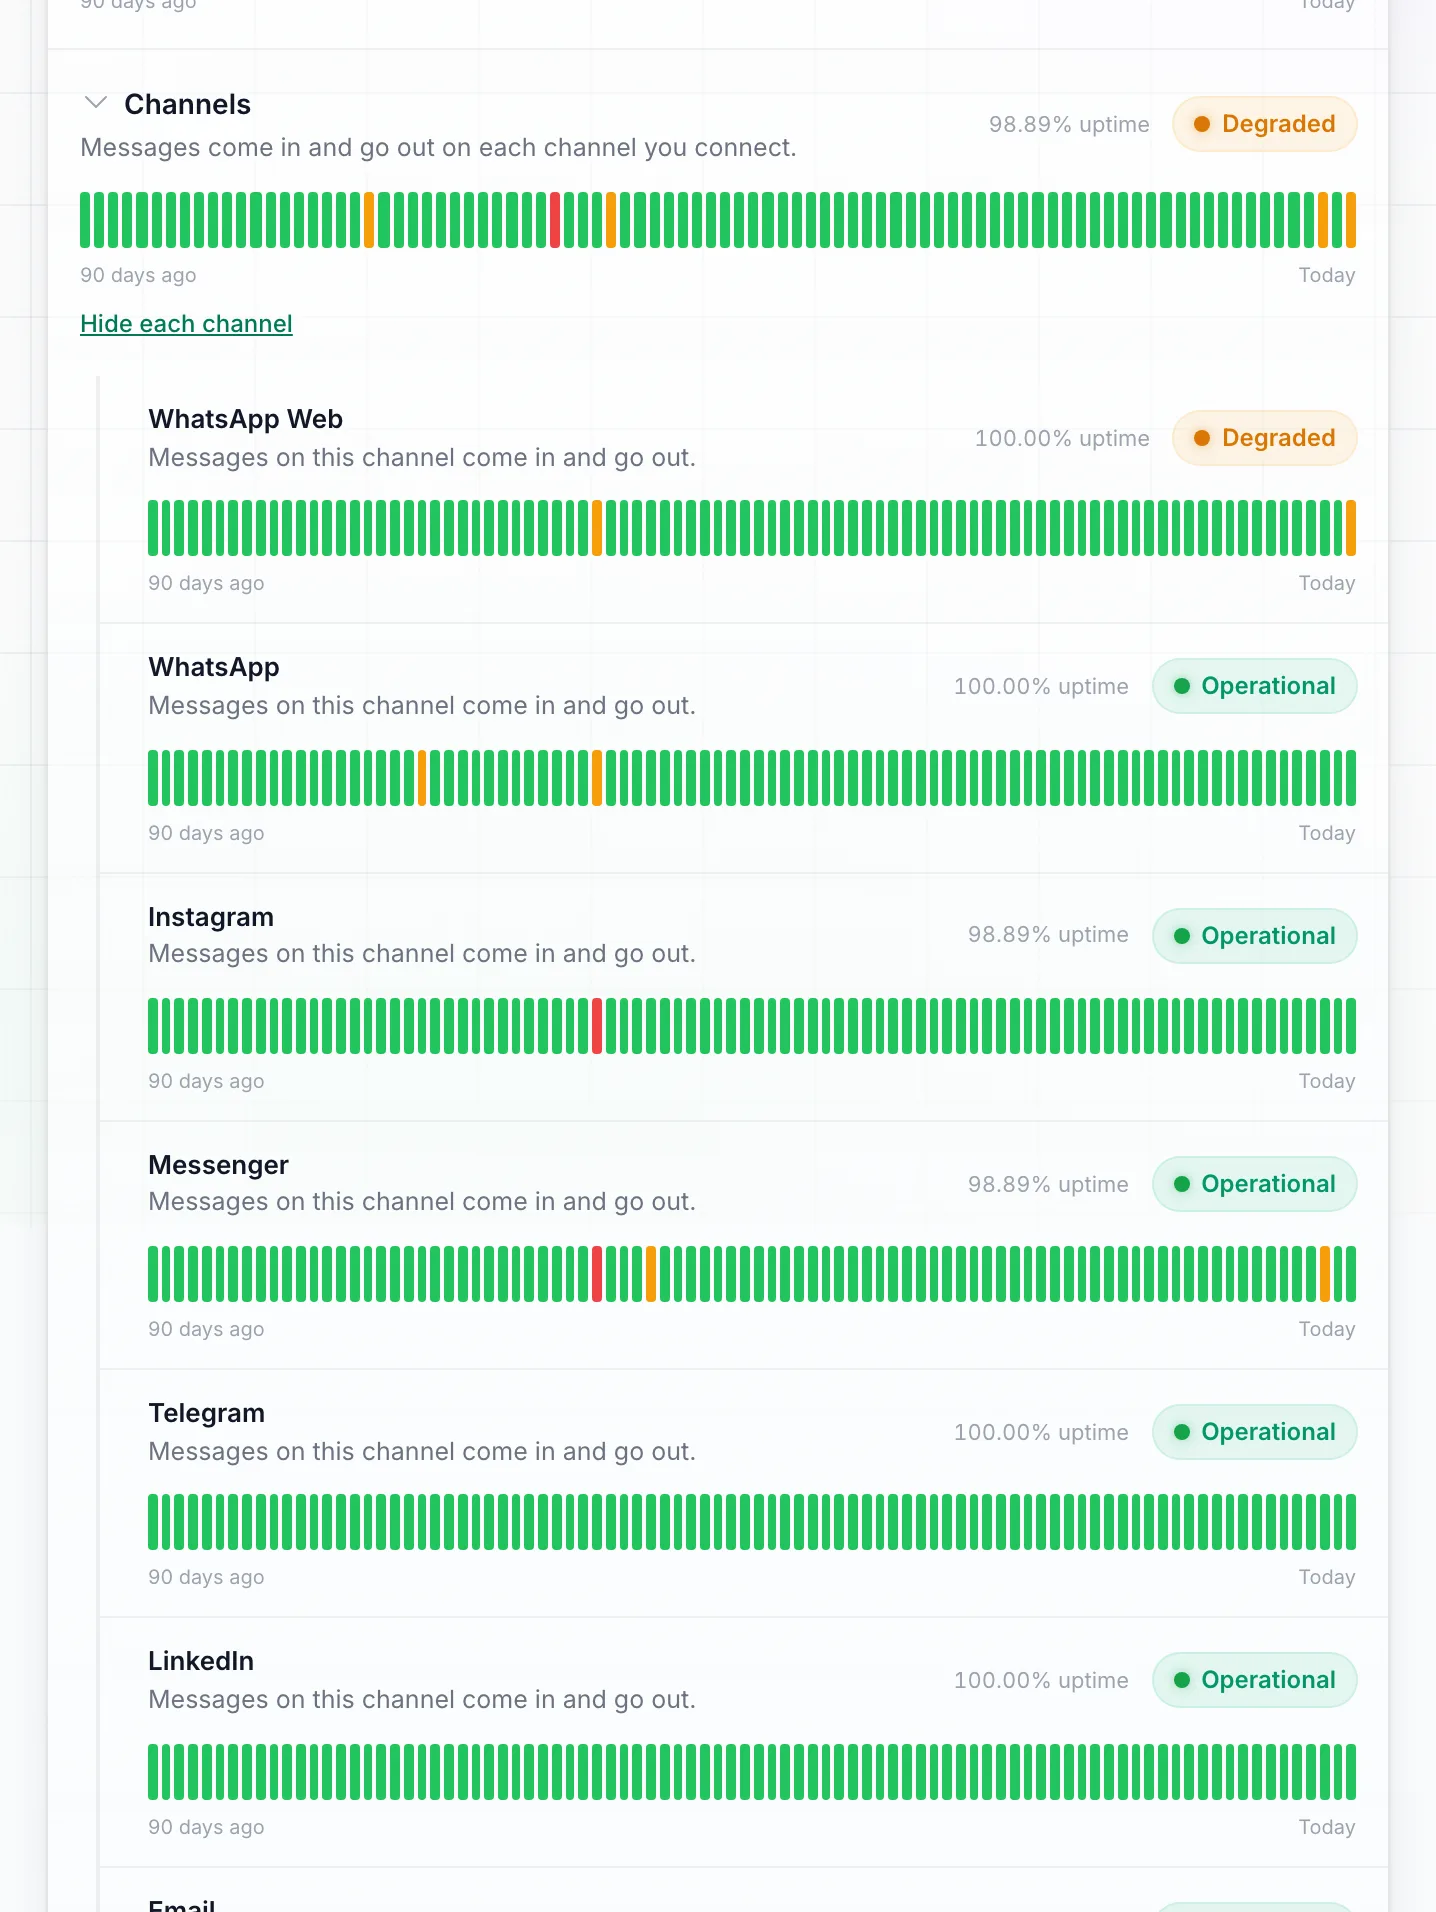
Click Channels or Show each channel to open a row per channel, each with its own bars and status. Hide each channel folds them away again.
A problem on one account’s own connection, like a single disconnected number, does not colour these rows: they turn amber or red only when a problem reaches the platform side of a channel or feature.
When one of these rows is Down, the overall banner shows Degraded rather than Down, because the rest of the platform keeps working. These rows don’t send outage emails to subscribers yet. When there is nothing to measure, or their data cannot be loaded, they show as working, never red.
Public Status Page
The same status page is also public at status.dmchamp.com, with no sign in needed. It shows the same parts of the platform, the same uptime history and the same Subscribe to updates form as the page inside the app, so you can check it, or share the link with your team, even when you can’t get into your account.
The page opens in your browser’s language. dmchamp.com/status takes you there too.
When Something Looks Off
- Degraded — things are still working but may be a little slower. This usually clears on its own within a few minutes.
- Down — we’re already aware and working on it. Your messages and data are safe, and anything queued will be delivered once the service is back.
- If the page itself can’t load, your account may still be working normally — wait a moment and press Refresh.
Looking for a specific failed message or action rather than the health of the platform? That’s the Error Log — one list of everything on your account that didn’t work, each with its own code and fix.
You don’t need to do anything to report an outage. If you’re ever unsure whether an issue is on our side or with a connected channel (like WhatsApp or Instagram), the System Status page is the quickest way to tell.